

Take me there
Overview
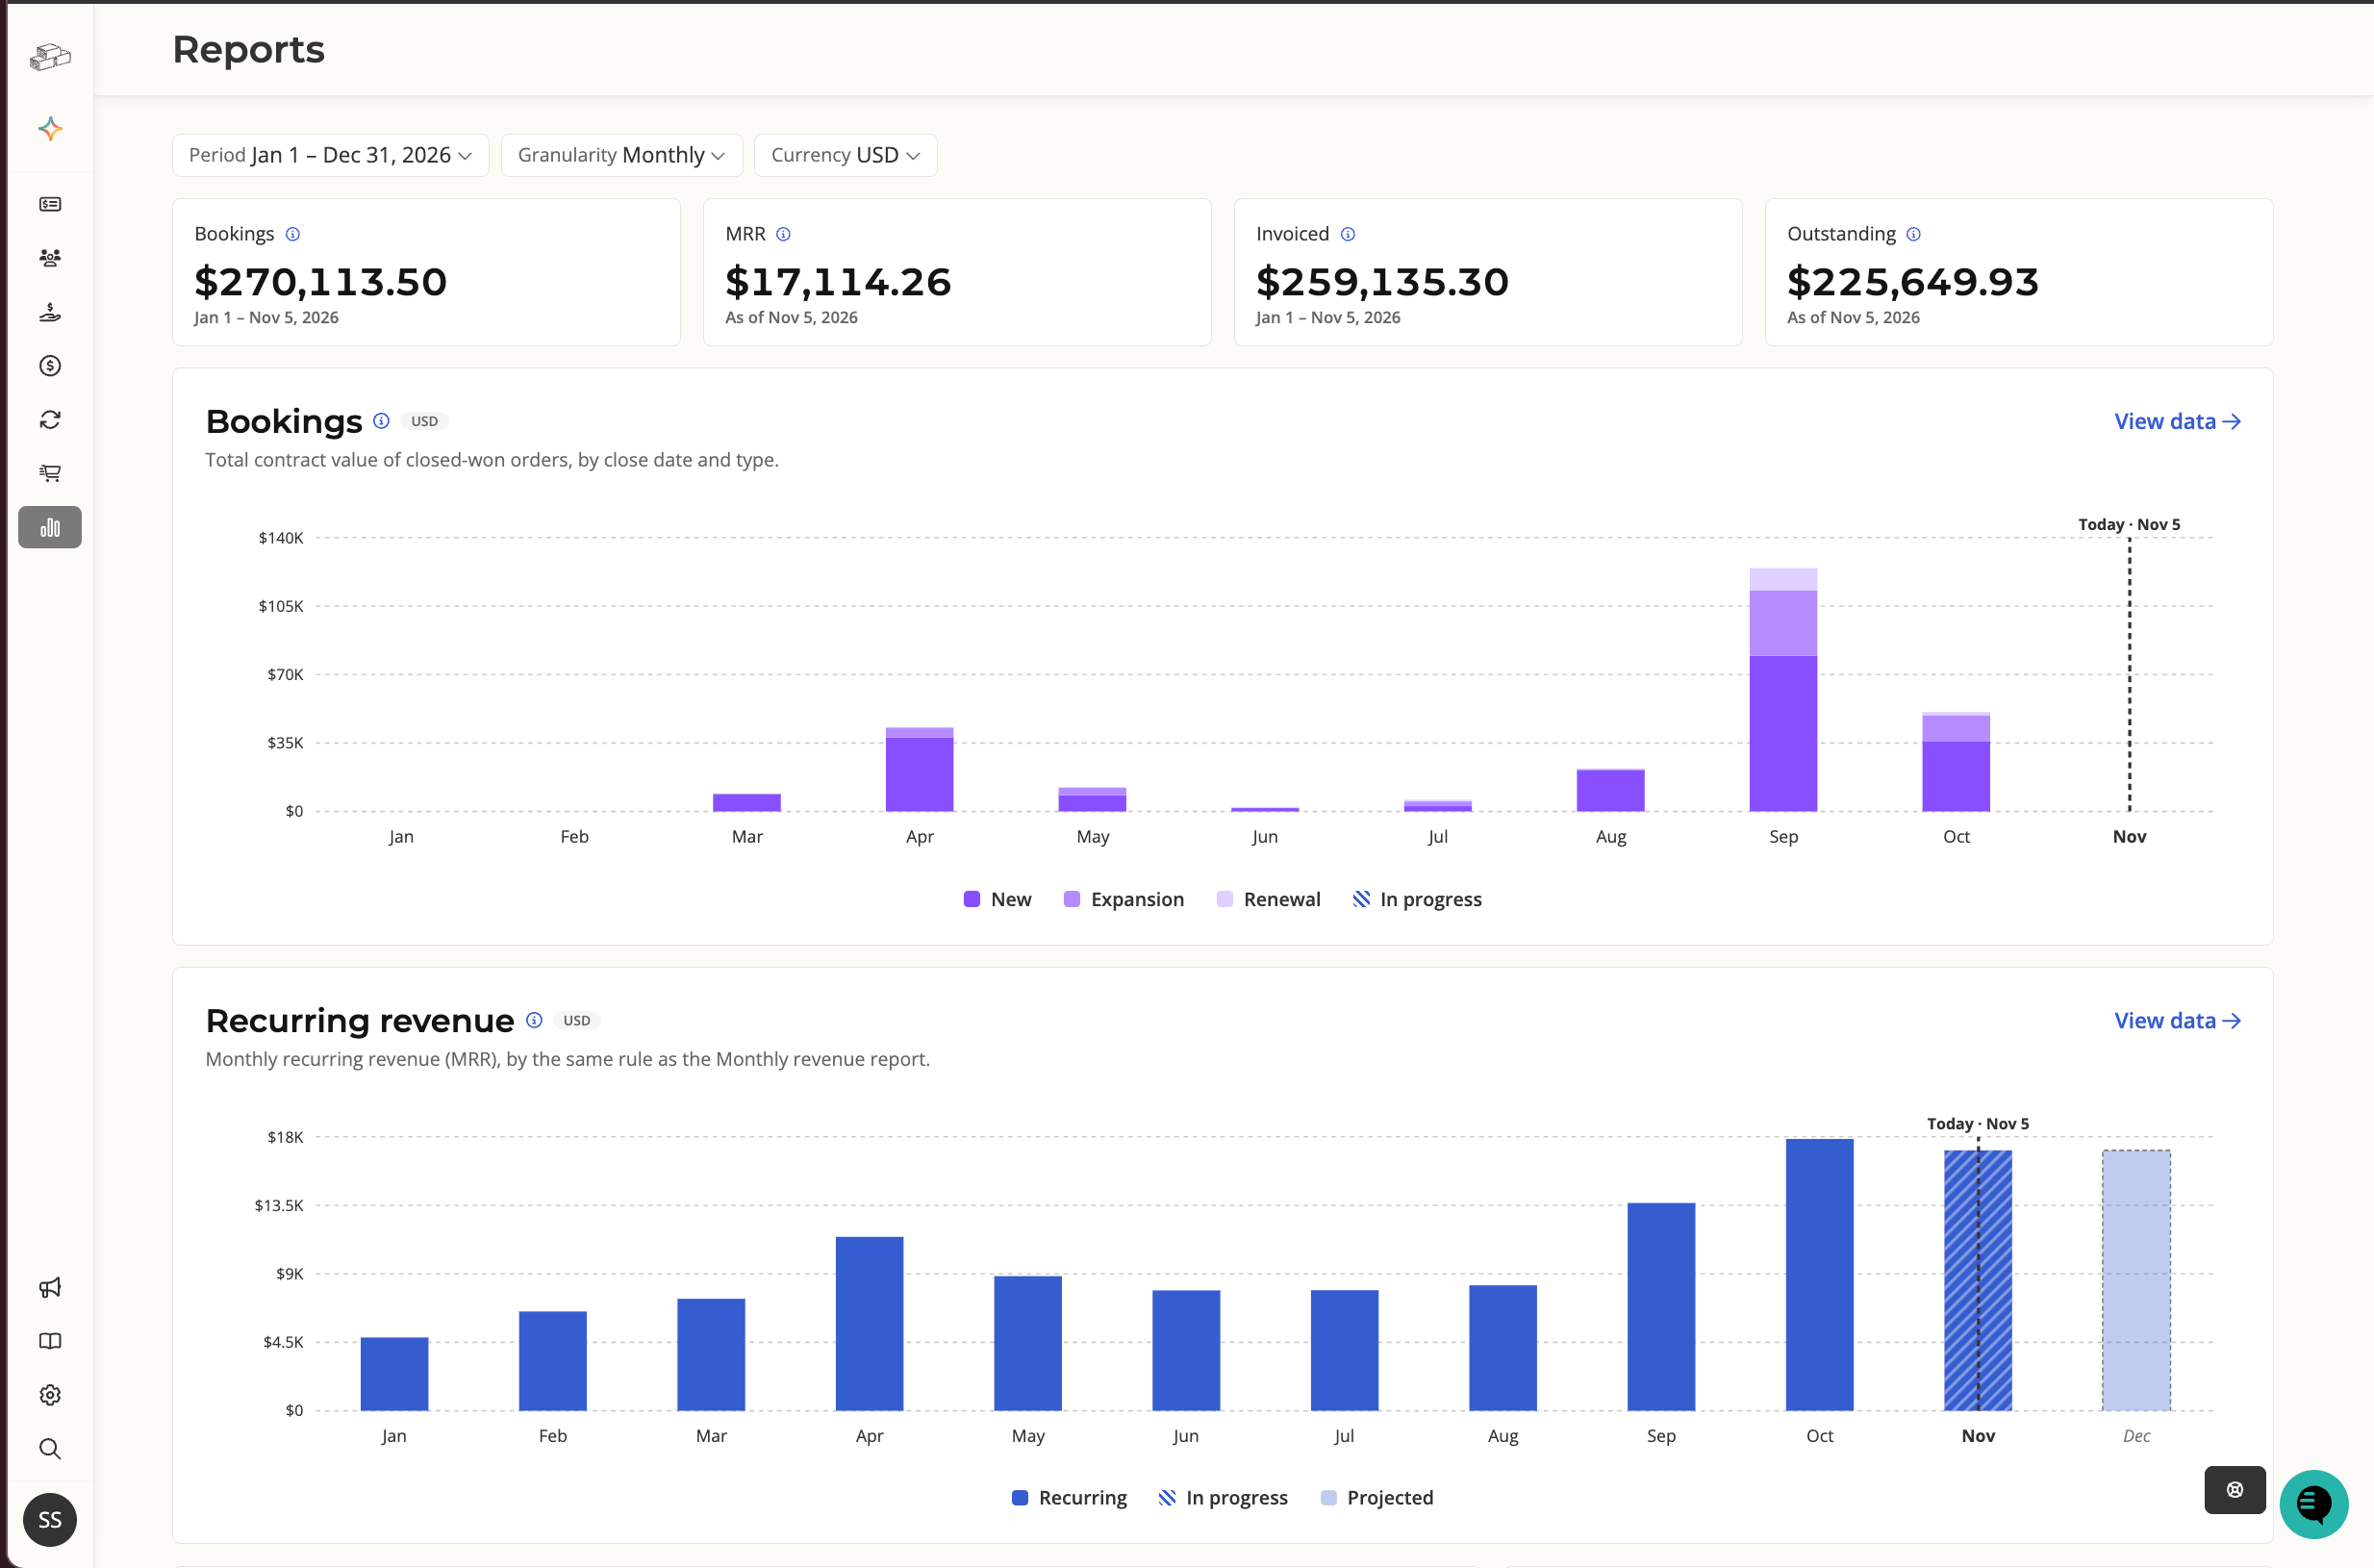
The Reports dashboard follows your revenue through its lifecycle on one page: what you booked, the recurring revenue it adds, what you invoiced, and what you collected.- KPI tiles at the top give you the headline numbers.
- One set of filters sets the period, granularity, and currency for the whole page.
- Every card explains what it counts. Hover the icon next to a card or tile title to see its full definition and what it excludes.
- Click through to the records. Click a bar, tile, or row to open the orders, invoices, or payments behind it.
Filters
The filter bar at the top of the page applies to every tile and card.- Currency appears when your account supports more than one currency. Every amount on the page is in the selected currency.
- Quarters and years follow your fiscal calendar, and weeks start on Monday.
- Your filters live in the page URL, so reloading the page or sharing the link opens the same view.
- Recurring revenue and Customers are recorded by month, so they show monthly bars when you choose Daily or Weekly. For periods longer than six months, Daily shows weekly bars.
- At Quarterly or Annual granularity, Recurring revenue and Customers show the last month’s value for each quarter or year instead of a sum. For a quarter or year still in progress, that’s the latest actual month.
KPI tiles
Four tiles summarize the lifecycle. Each tile uses the same data and definition as its card, so the tile and the chart below it always agree.
The label under each value names the dates it covers, such as the date range or “As of” date.
Cards
Each card shows its title, the currency, a one-line definition, and a View data link to the full report behind it. The Bookings, Recurring revenue, Invoiced, and Customers charts mark Today on the timeline. The bar that holds today is shaded as in progress, and Recurring revenue also shows Projected bars for future months.Bookings
The total contract value of closed-won orders, counted on the date each order closed. Each order counts at its full value across every phase, net of plan credits. Bookings are split by order type:- New: new business orders
- Expansion: upgrades and recasts, with recasts counted at their restated net total
- Renewal: renewal orders
Recurring revenue
Monthly recurring revenue (MRR) from recurring charges, calculated with the same rule as the Monthly revenue report. Usage, overage, one-time, and milestone charges are not included. For the full formulas, see MRR & ARR Calculations. Future months are projected: they assume active subscriptions continue past their end date until they renew or are terminated. MRR is a run rate. When revenue recognition is enabled for your account, the card also links to Revenue recognition for recognized revenue under ASC 606.Invoiced
Invoices on closed-won orders issued in each period, counted on the issue date and split by charge type:- Subscription: recurring charges
- Usage & overage: usage and overage charges
- One-off: one-time and milestone charges
Collected
Successful payments received in four windows that run through today:- This week
- This month
- This quarter
- FY to date
Outstanding
Every open invoice balance, grouped by days past due:- Current (not yet due)
- 1 – 30 days
- 31 – 60 days
- 61 – 90 days
- 91 – 120 days
- 120+ days
Customers
Customers with an active subscription at the end of each month, split into Existing customers kept from the month before and New logo customers. Hover a bar to see how many customers churned that month. View data opens the Customer count report.Open the records behind a number
Hover any bar, tile, or row to see its breakdown. When it shows Click to view data, click it to open the exact records behind that number. You can also Tab to a bar and press Enter.Outstanding rows and the Outstanding tile open Billing when the card’s As of date is today,
because Billing shows current balances.
All reports
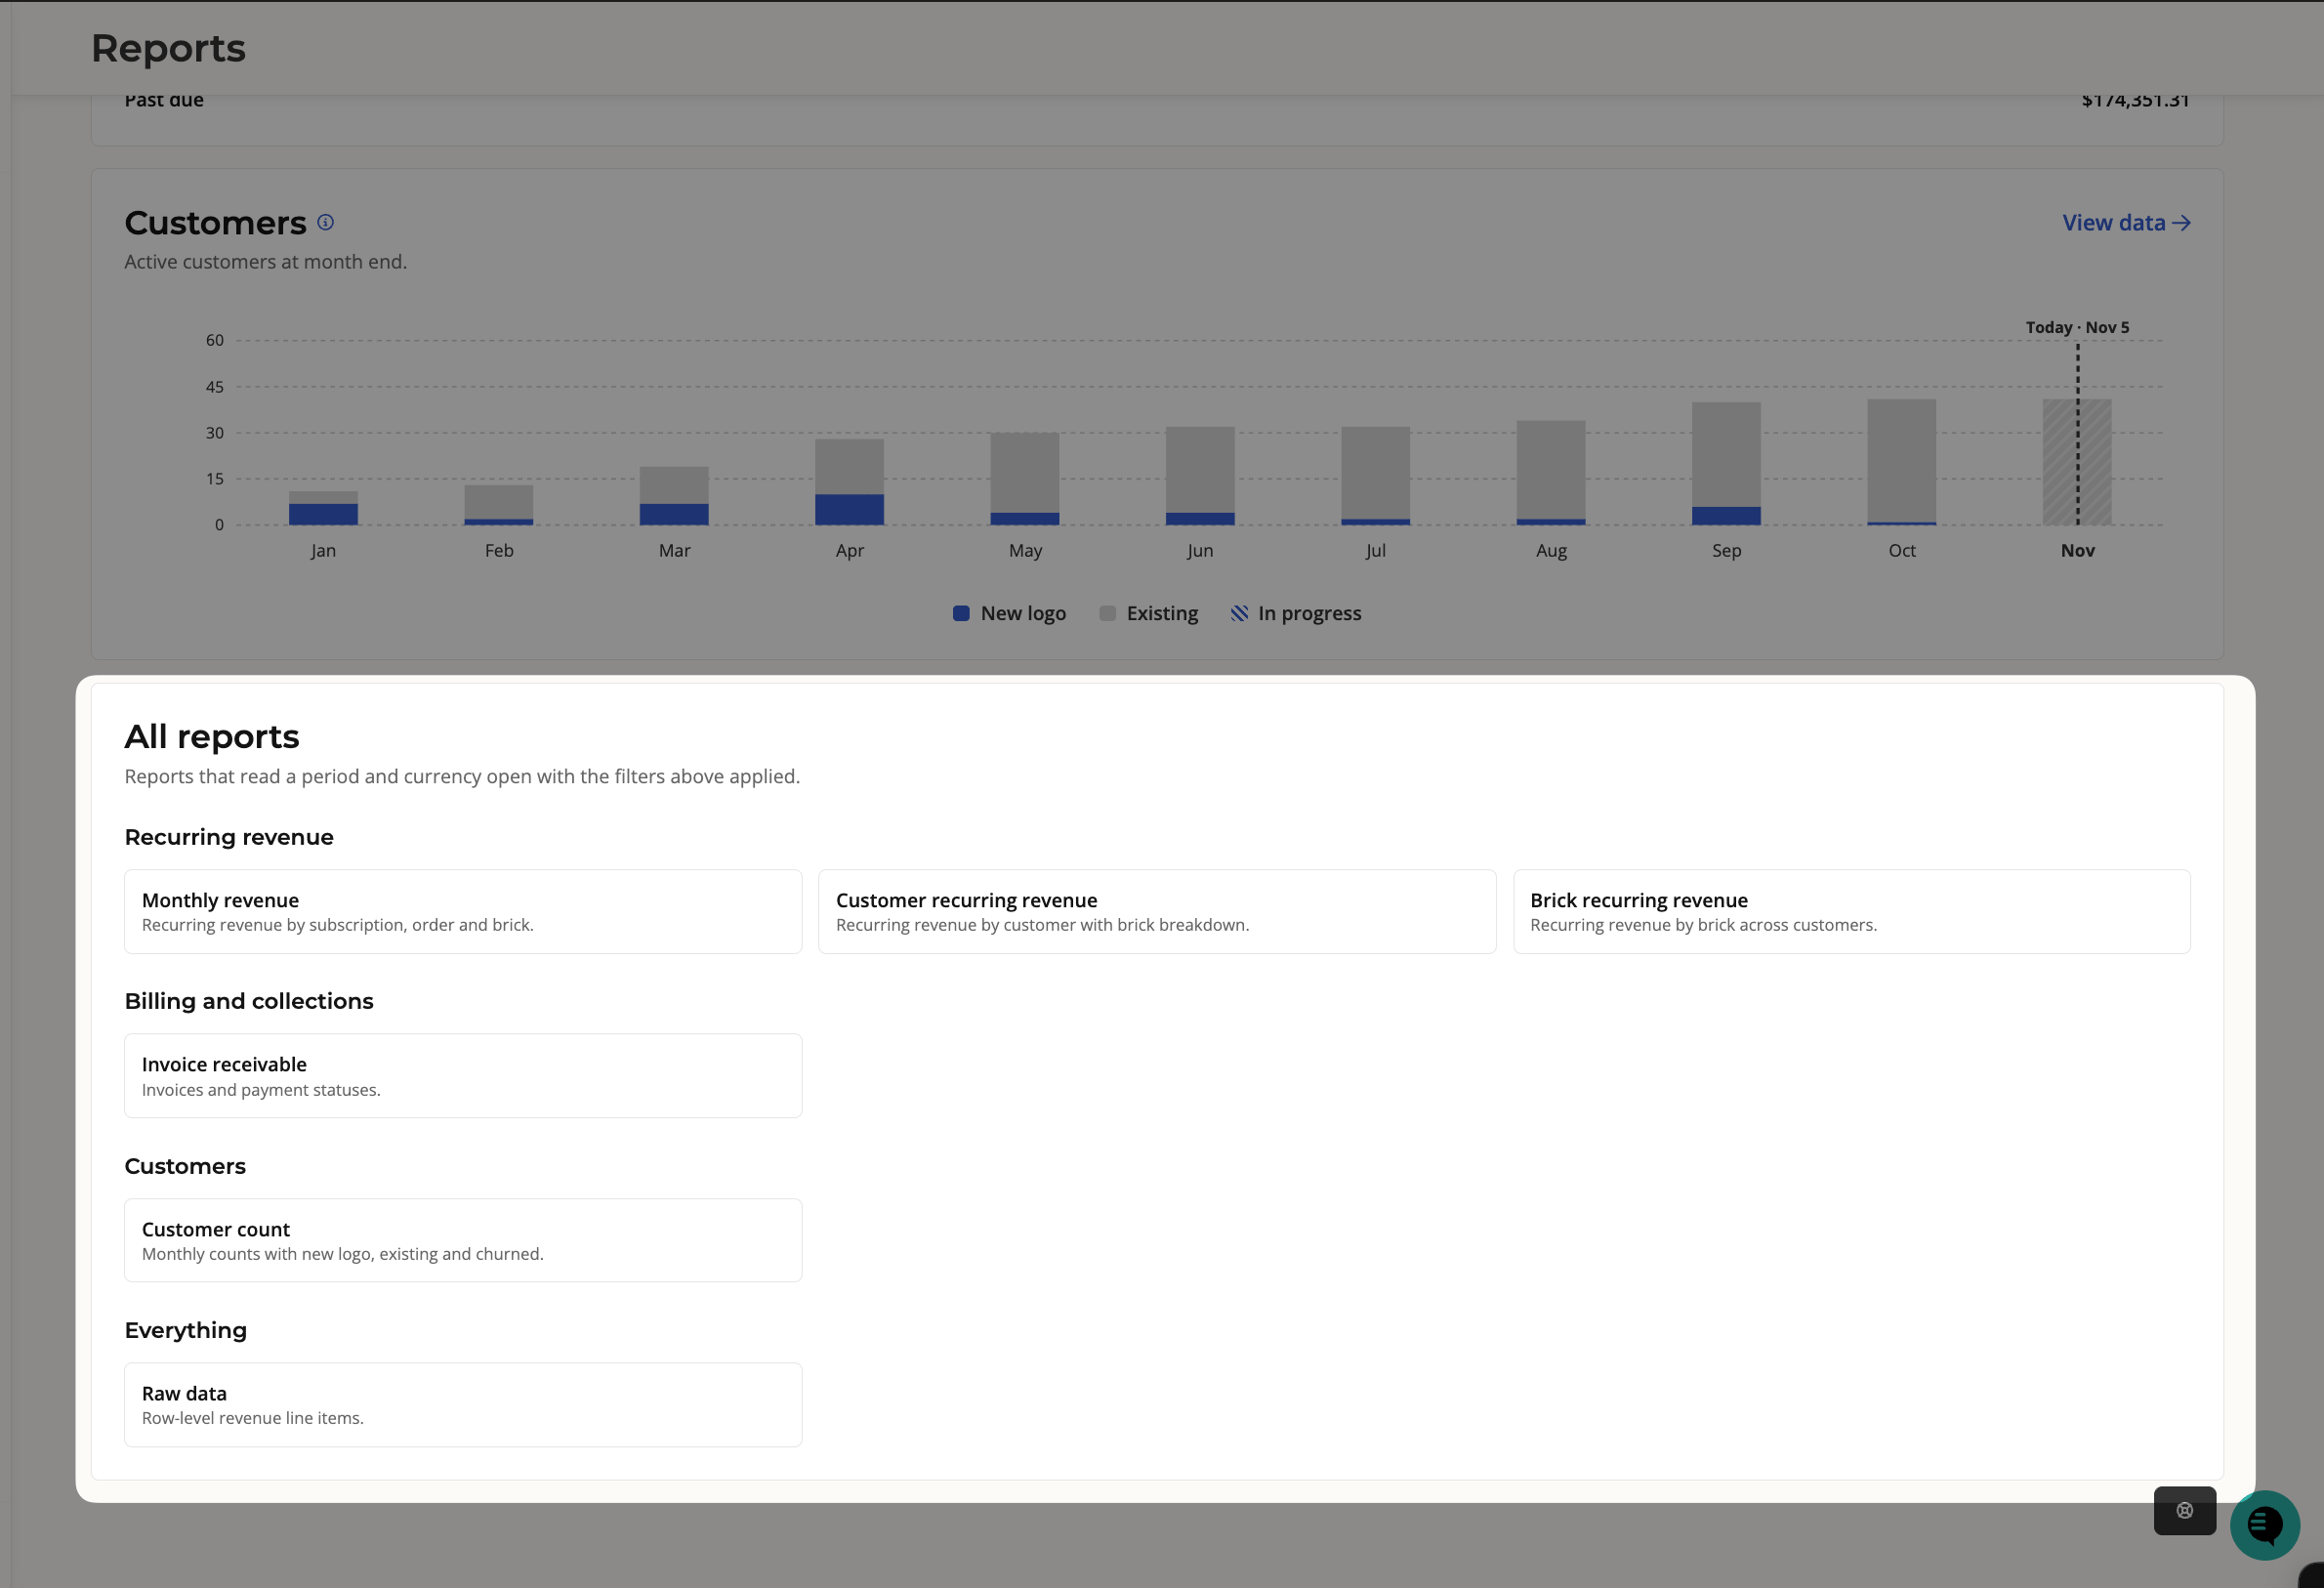
Monthly revenue
Recurring revenue by subscription, order, and Brick for each month. See MRR & ARR Calculations for how each value is calculated.Customer and Brick recurring revenue
The Customer recurring revenue report shows recurring revenue by customer, with a breakdown by Brick. The Brick recurring revenue report shows recurring revenue by Brick across customers. Both reports can show values as ARR with Show as ARR.Revenue recognition
Recognized revenue under ASC 606, with revenue schedules and journal entries. This report appears when revenue recognition is enabled for your account.Invoice receivable
Opens the Billing page filtered to due, past due, and partially paid invoices.Customer count
Your customer count, with one column per month and a row for each measure:- Start Of Month Total: customers at the start of the month
- Added This Month: new customers added
- Churned This Month: customers whose subscriptions ended
- End Of Month Total: customers at the end of the month